Download presentation
Presentation is loading. Please wait.

1
Chapter 2

2
Section 1 Topography = the shape of the land
Elevation – height above sea level Relief – difference in elevation between highest and lowest point Landforms – feature of topography formed by the processes that shape Earth’s surface

3
Landforms PLAIN

4
Plain Plain – a landform made up of nearly flat or gently rolling land with low relief. Coastal Plain – a plain that lies along a seacoast (low elevation, low relief)
")
5
Landforms Mountain

6
Mountains Mountain – a landform with high elevation and high relief
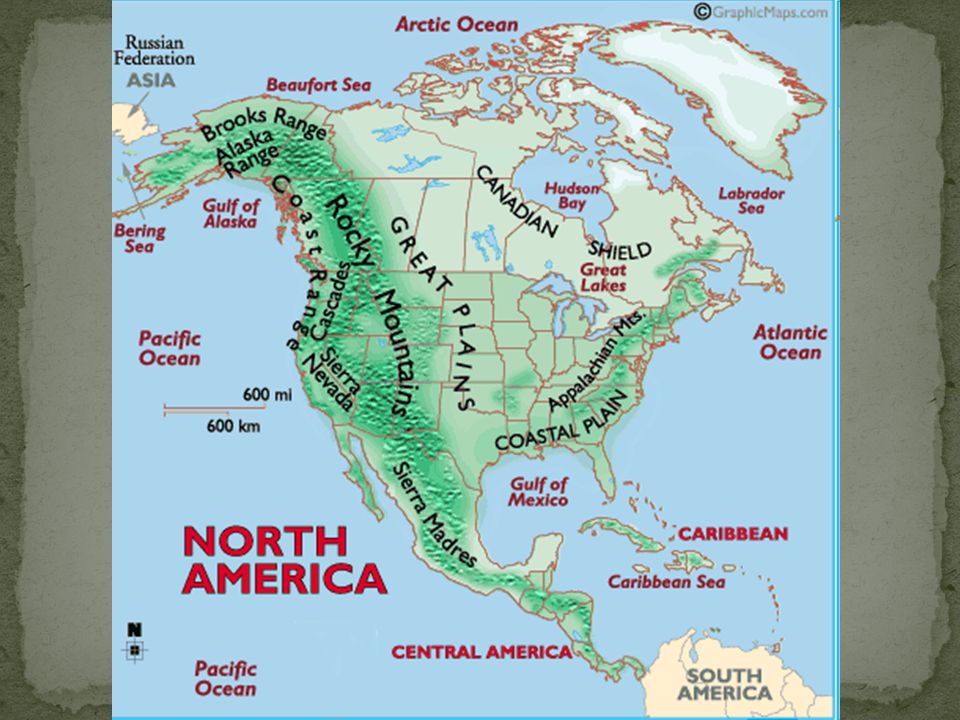
Mountain range – a group of mountains that are closely related in shape, structure and age Mountain system – different mountain ranges in a region Mountain belt – mountain ranges and mountain systems in a long, connected chain form a larger unit (ex. Rocky Mtns)
")
7
Landforms Plateau

8
Plateau Plateau – landform that has a high elevation and a more or less level surface

9
Landform Region A large area of land where the topography is made up mainly of one type of landform. Great Plains Rocky Mountains

11
Section 2 If you were standing on Earth…how would you know what shape it was? If you were sailing…how would you figure out the shape of Earth?

12
Map vs. Globe MAP GLOBE FLAT MODEL SPHERE All or part of Earth’s surface Earth’s entire surface Seen from above Scale Symbols Key Compass

13
Map vs. Globe Which version is more accurate relative to size, shape and positions of objects? THE GLOBE!!!!

14
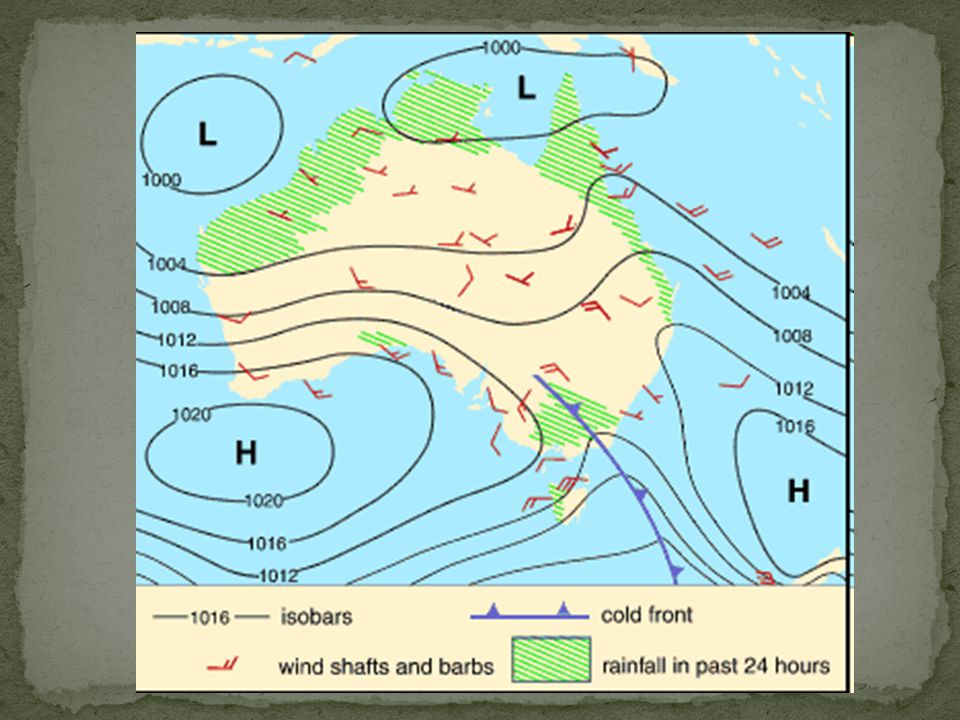
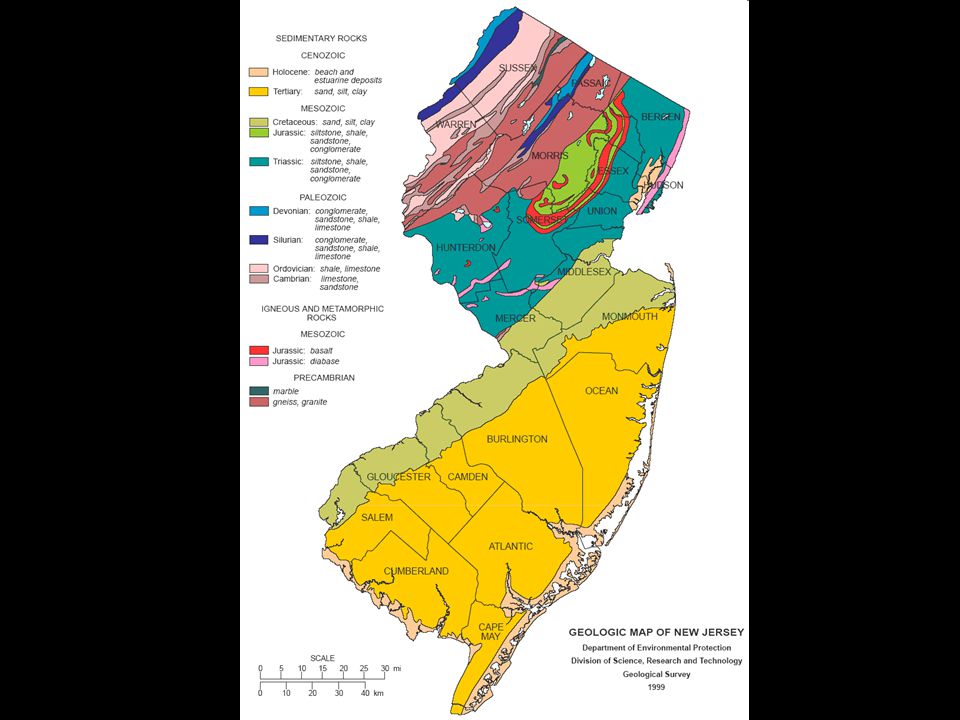
Features Scale – relates distance on a map to a distance on Earth’s surface Symbols – shapes and pictures that stand for feature on Earth’s surface Key – a list of all the symbols used on the map with an explanation of their meaning

18
Earth’s Reference System
To locate positions on Earth’s surface, scientists use degrees.

19
Earth’s Reference System
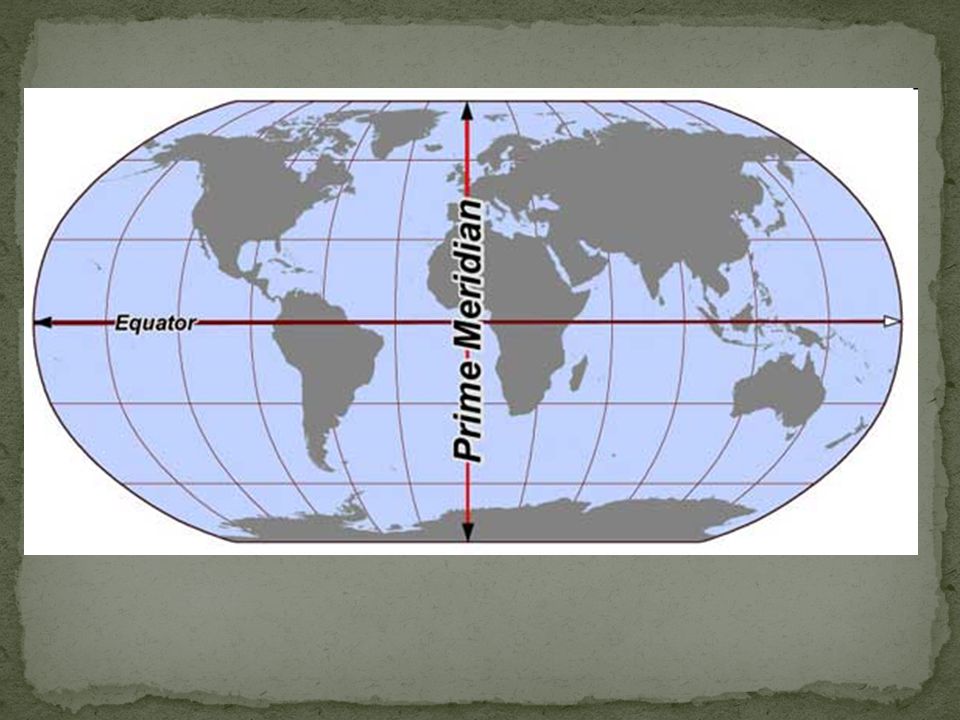
The equator forms an imaginary line that circles the earth.

20
The equator divides Earth into Northern and Southern hemisphere.

21
Earth’s Reference System
A second imaginary line called the Prime Meridian makes a half circle from the North Pole to the South Pole and it passes through Greenwich, England. Areas that are east of the Prime Meridian are in the Eastern Hemisphere while areas west of the Prime Meridian are in the Western Hemisphere.

23
Reference System Maps and globes show gridlines as a reference.

24
Earth’s Reference System
Whether a map or a globe, lines of latitude and longitude form a grid that can be used to locate things on Earth’s surface

25
Latitude – measures degrees north or south of the equator

26
Longitude – measure degrees east or west of the prime meridian

27
Locating a Point

28
Map Projection = a framework of lines that helps in transferring points on Earth’s three-dimensional surface onto a flat map. 3 types Mercator Conic Equal Area

29
Mercator Projection

30
Mercator All lines of latitude and longitude appear as straight, parallel lines that form a rectangle Size and shape of landmasses near the equator are distorted a little, but they become more distorted as you go towards the poles

31
Conic Projection

32
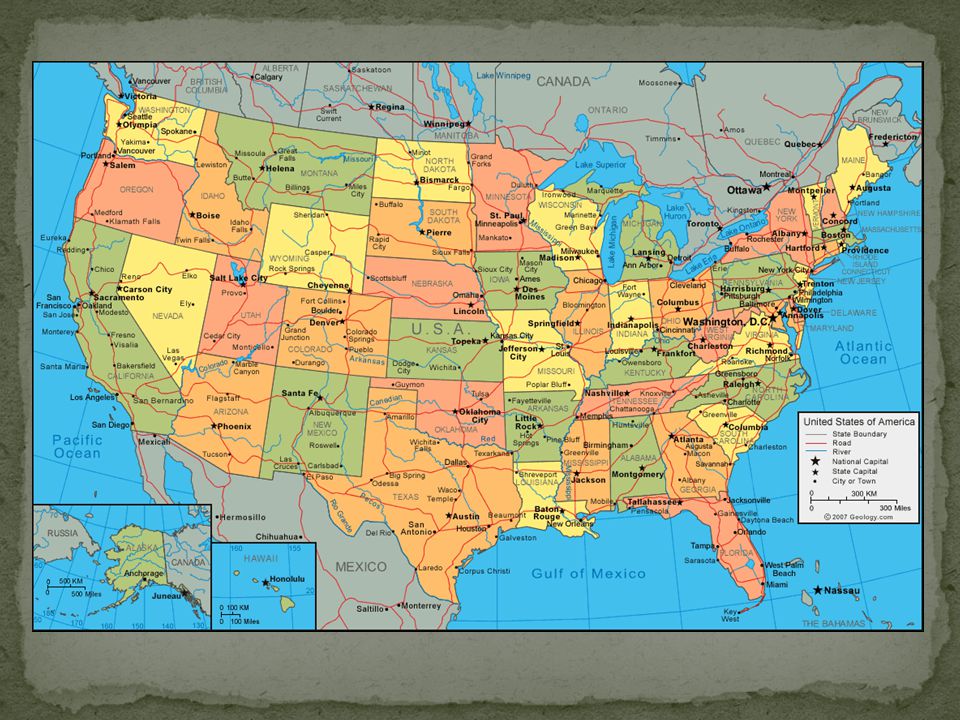
Conic Lines of longitude appear as straight lines while lines of latitude are curved Little distortion because it only shows a small part of Earth’s surface Frequently used for maps of the continental United States

33
Equal Area Correctly shows the relative sizes of Earth’s landmasses
Shapes of landmass near the edges of the map appear curved and stretched

34
Section 3 How do you draw maps without satellites?
Sketch the coastline from a ship Surveying = mapmakers determine distances and elevations using instruments and the principles of geometry Photographs from airplanes

35
What do we use to make maps today?
COMPUTERS

36
Maps Using computers, maps can be stored, processed and displayed electronically Digitizing = the process by which mapmakers convert the location of map points to numbers Data is stored as 0s and 1s

37
Sources of Map Data Computers produce maps using data from many sources Satellites – Landsat satellites to observe Earth’s surface Global Positioning System (GPS)
")
38
Satellite Images = picture of the surface based on data
Made up of thousands of pixels Pixel = thousands of tiny dots

40
Global Positioning System
GPS = a method of finding latitude, longitude and elevation of points on Earth’s surface using a network of satellites.

41
Section 4 Topographic Map = a map showing the surface features of an area Uses symbols to portray land Looking down from above Shows elevation, relief and slope

42
Elements of a Topographic Map
Elevation –Height above sea level Relief – the difference between the highest elevation and lowest elevation of an area. Slope – the angle of Earth’s surface

43
Topographic Map Uses contour lines to represent elevation, relief and slope Contour line = connects points of equal elevation

44
Where are the contour lines?

45
Topographic Map Contour interval = change in elevation from contour line to contour line Same for all of the map!

46
Topographic Map Index contours = darker, heavier lines labeled with the elevation in round units

47
Reading a Topographic Map
Scale Ex. 1:24,000 means 1 centimeter equals 0.24 kilometers Symbols Found in the Key Used to show houses, building, rivers, highways, etc. Interpreting Contour Lines

48
Interpreting Contour Lines
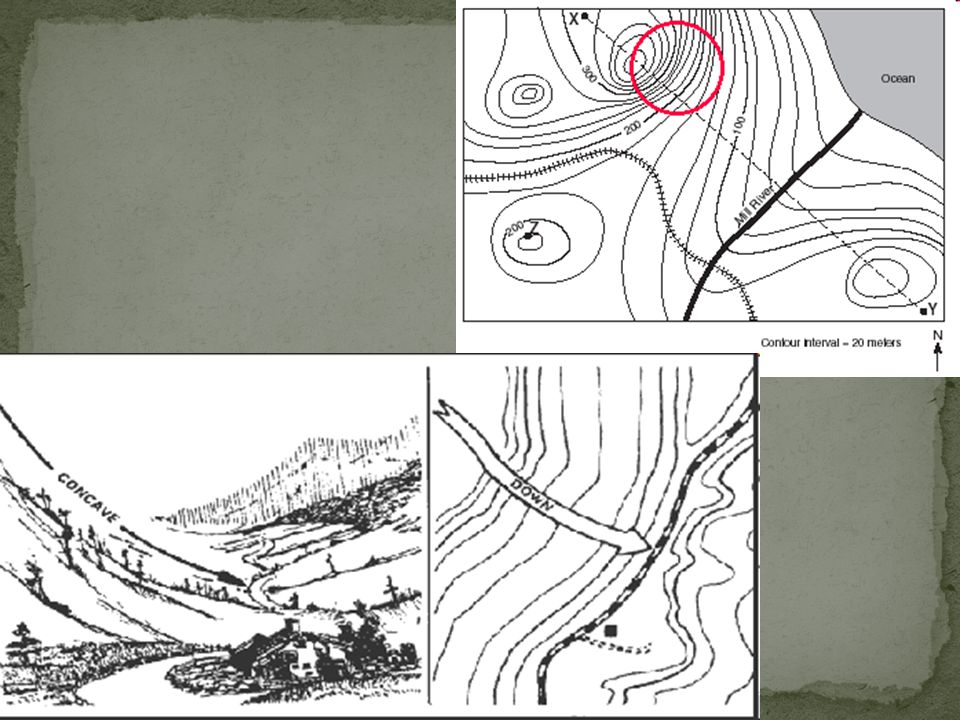
Closely spaced contour lines indicate a STEEP SLOPE Widely spaced contour lines indicate GENTLE SLOPES OR FLAT AREAS

50
Interpreting Contour Lines
Contour line that forms a closed loop with no other contour lines inside indicates a HILLTOP Closed loop with dashes inside indicates a DEPRESSION

52
Interpreting Contour Lines
V shaped lines pointing downhill indicate a ridge line

53
Interpreting Contour Lines
V shaped lines pointing uphill indicate a valley

54
Uses of Topographic Map
When would you use a topographic map? Engineer designing a highway Build new stores Build new houses New schools or buildings Bicycle trip/hiking

55
PRACTICE!!!

56
MORE PRACTICE!!

57
LET’S TRY IT!!!!!!!

Similar presentations


 W (Want to know) L (What I learned) Warm up- take out a piece of paper and do the “K” and the “W” for the above topic.>")


