Download presentation
Presentation is loading. Please wait.

1
The Dismal Economy Heather Boushey Center for Economic and Policy Research 8 April 2005

2
Introduction My job today is talk to you about the state of the labor market and opportunities for upward mobility. Unfortunately, this will not be an optimistic talk. Trends have gotten worse over the past few years and policy responses have only added to the problem. Inequality tears at the promise of the “American Dream,” because it’s harder today to make ends meet and achieve a stable middle-class lifestyle.

3
Inequality: Overview Growing since early 1970s. Slowed, but did not reverse course, during the late 1990s. –Grew during recession/recovery. Progress in gender and racial equity has stalled. –Gender gap increased in 2003.

4
Latest data on income (from 2003) In 2003, income was stagnant, poverty was up and health insurance coverage— especially health insurance from an employer—was down. Further, while low-income households saw falling incomes, high-income households saw their income rise.

5
Slow Job Growth Today, the economy only has 415,000 more jobs that it did when the recession began in March 2001. Had the share of Americans working remained at its 2000 level, 4.5 million more people would have had jobs in March 2005.

6
Wages down Tepid job growth is tough on the wallets of America’s families. Wages are lower today than they were in 2002, in inflation-adjusted terms. Low-wage workers hit harder than higher waged workers.

7
Rich Got Richer In 2003, income for households in the top income bracket rose—by 1.1 percent, up to $86,867. Families whose total income places them the bottom fifth of household lost ground—as their incomes fell by 1.9 percent, to $17, 984. Gap between the top and the bottom grew, and is in fact higher that any other time since the U.S. Census began surveying annual income in 1967.

8
Pulling away from middle as well And it’s not just that the rich are getting richer while the poor are getting poorer. Wealthy households are pulling away from the middle as well. For the first time, households at the 80th percentile have twice the income of those in the middle.

9
Growth in real family income, 1947 to 1973 Source: CEPR analysis of Bureau of Labor Statistics data.

10
Growth in real family income, 1973 to 2003 Source: CEPR analysis of Bureau of Labor Statistics data.

11
Minority and non-native households saw incomes fall, relative to whites African-American households had the lowest median income at $29,689—62 percent of the median for non-Hispanic white households ($47,777). Among Hispanic households, median income was $32,997 in 2003, down by 2.6 percent from 2002. Households headed by a non-citizen saw income fall by 5.6 percent to $32,806.

12
Gender gap increased in 2003 In 2003, full-time women workers earned only 76 cents for every dollar earned by full-time men, down from 77 cents in 2002. The gap increased because women’s median earnings fell by 0.6 percent, down to $30,724, while men’s median earnings remained unchanged at $40,668.

13
More Poor Americans There were 1.3 million more people in poverty in 2003 and the poverty rate, which rose by 0.4 percentage points in 2003, now stands at 12.5 percent—increasing for the third year in a row. Poverty rose more even for children, increasing from 16.7 percent in 2002 to 17.6 percent in 2003. Poverty rose by 1.4 percentage points among female-headed households, up to 28.0 percent. This is the highest rate since 1998.

14
Changes in intergenerational mobility Source: Blanden and Machin (2002), Table 5.
, Table 5.")
15
Income inequality in OECD Countries Source: Mishel, et al. The State of Working America 2004-05.

16
Health insurance coverage down Tying health insurance coverage to employment means coverage falls when employment is low. An estimated 45.0 million people—15.2 percent of all Americans—were without health insurance for the entire year in 2003, an increase of 1.4 million from 2002. In most years, another 20 percent of Americans go without health insurance at some point during the year, but are not without coverage the entire year.

17
Health insurance coverage for those with jobs, as well Even those who had jobs saw their uninsurance rate rise from 19.5 percent in 2002 up to 20.2 percent in 2003, a 0.7 percentage point increase. Health insurance coverage fell mostly because the share of Americans who had employer-based coverage at some point during the year declined between 2002 and 2003, falling from 61.3 percent down to 60.4 percent.

19
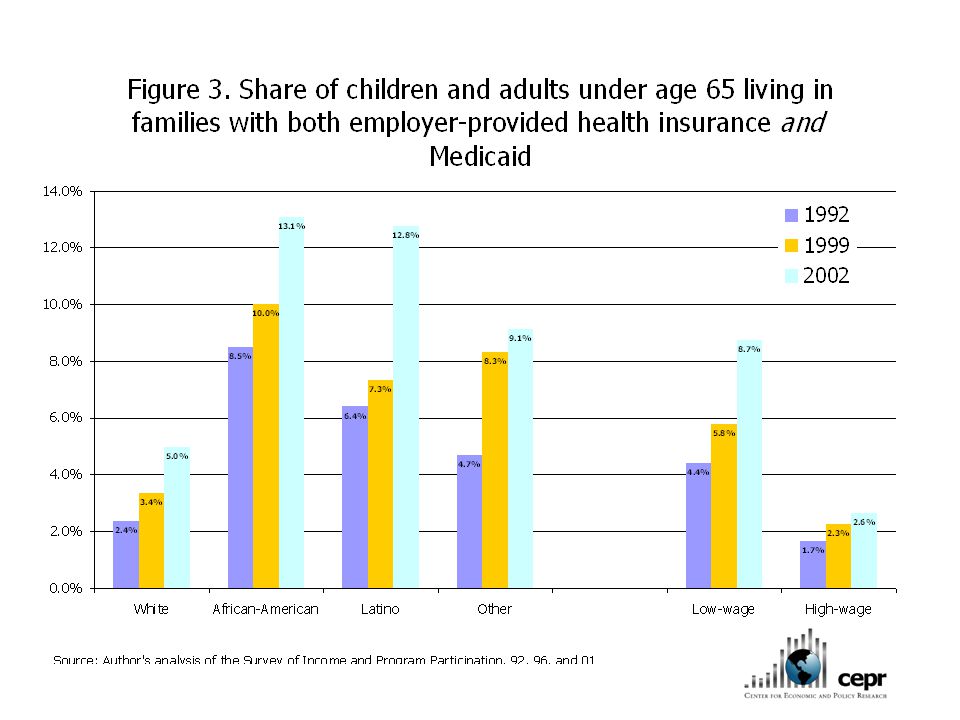
Children and health insurance coverage The drop in employer-provided health insurance was even sharper among children, falling by 1.8 percentage points, from 63.0 percent down to 61.2 percent. Medicaid coverage for children rose by 2.4 percentage points, however, from 24.0 to 26.4, offsetting declines in employer-based coverage. The share of children without any health insurance remained steady at 11.4 percent.

21
Current issues for Medicaid Budget proposal: $45 billion cuts over the next ten years. The proposed Medicaid cuts translate into an average of 1.2 million fewer children accessing the Medicaid system each year between 2006 and 2010. Medicaid costs less per beneficiary than private health insurance plans. The problem is that health care costs have been outstripping inflation for years.

Similar presentations


>")
