Download presentation
Presentation is loading. Please wait.

1
1 U.S. Poverty Trends: why has the official U.S. poverty rate been stuck at 11-16% since 1971 ? World Poverty and Economic Development ECON 3240 Fordham University

2
Poverty, inequality & mobility Absolute Poverty Absolute deprivation: less than some physical minimum (malnutrition) $1/day consumption Poverty line constant for long periods of time (50 years in U.S. & world) UN, U.S., UK and World Bank use absolute poverty lines Relative Poverty Relative deprivation: inequality: what is my share? Top 1%, CEO salaries; varies by cty Typically 1/3 of median middle class income or consumption: how close are poor to social norm? Europeans use relative poverty measures– social stability
 UN, U.S., UK and World Bank use absolute poverty lines Relative Poverty Relative deprivation: inequality: what is my share. Top 1%, CEO salaries; varies by cty Typically 1/3 of median middle class income or consumption: how close are poor to social norm. Europeans use relative poverty measures– social stability.")
3
U.S. Poverty line depends on family size, about $11/day compared to $1.25/day Is poverty relative? A family with $11/day would be considered middle class in developing countries, Adam Smith’s Linen Shirt (and shoes and plumbing and… ). Source: 2014 Poverty Guidelines, Office of ASPE Heath and Human Services, http://aspe.hhs.gov/poverty/14poverty.cfm 3
. Source: 2014 Poverty Guidelines, Office of ASPE Heath and Human Services, 3.")
4
4 Key trends in U.S. Poverty http://aspe.hhs.gov/hsp/14/PovertyAndIncomeEst/ib_poverty2014.pdf

5
5

6
6

7
7

8
8

9
9

10
10 Key trends in U.S. Poverty http://aspe.hhs.gov/hsp/14/PovertyAndIncomeEst/ib_poverty2014.pdf

11
11 Key trends in U.S. Poverty

12
12 Poverty among Children rises during recessions… why (click figure for 2012 data)
")
17
Help for the working poor Earned income credit (EIC or EITC) Food stamps way up Extended unemployment benefits. Doubling up, young people 25-35 living at up to 13% from 9% (failure to launch, mainly boys…)
.")
18
Help for the working poor

19
19 Key trends in U.S. Poverty From 1945 to 1959 poverty fell rapidly from 33% to 22%, number of poor fell by 1.4 million per year From 1959 to 1972 poverty fell rapidly from 22% to 11.3%, but stopped falling in the 1970s From 1980 to 1993 poverty rose to about 14% as unemployment rose & men’s wages fell. Poverty among children rose to about 25% in 1980s, while for the elderly poverty fell steadily to under 10% (9.7% in 1999). From 1993 to 2000 the overall poverty rate fell back to about 12%, declining most rapidly for children, African Americans and Hispanics. From 2000 to 2010, rose back to 15% due to high unemployment of “great recession.
. From 1993 to 2000 the overall poverty rate fell back to about 12%, declining most rapidly for children, African Americans and Hispanics. From 2000 to 2010, rose back to 15% due to high unemployment of great recession..")
20
20 Why has U.S. not achieved MDG -1 (officially) 1. Women’s agency increasing (peaking? see Pew report on earnings by gender) 2. We mismeasure consumer prices: as much as 1% too high since, a 2 edged sword, a chain index would be better, why can’t we fix it? 3. Most in-kind transfers not counted in official poverty measure (food stamps, housing subsidies, EITC). 4. Lack of an ACA? See the welfare to work diagrams….welfare to work 5. High rates of Immigration, poverty and inequality figures are misleading, poverty in our hemisiphere has fallen, even as U.S. poverty remains high.
 2. We mismeasure consumer prices: as much as 1% too high since, a 2 edged sword, a chain index would be better, why can’t we fix it. 3. Most in-kind transfers not counted in official poverty measure (food stamps, housing subsidies, EITC). 4. Lack of an ACA. See the welfare to work diagrams….welfare to work 5. High rates of Immigration, poverty and inequality figures are misleading, poverty in our hemisiphere has fallen, even as U.S. poverty remains high..")
21
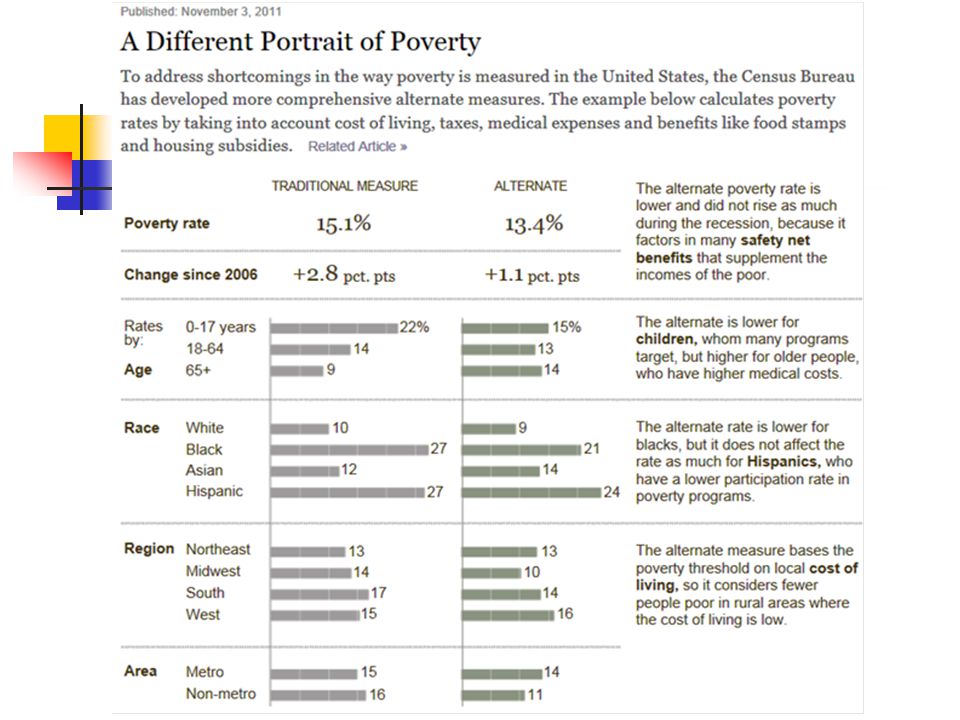
Almost no increase in adjusted NAS measures 21

22
22 Percentage of People in Poverty by State Using 2- and 3-Year Averages: 2008-2009 and 2010-2011 (People as of March of the following year. For information on confidentiality protection, sampling error, nonsampling error, and definitions, see www.census.gov/apsd/techdoc/cps/cpsmar12.pdf)

23
23 Poverty among Children Fell During the 1993-98 Economic Boom

24
24 African American and Hispanic Poverty fell in 1990s to lowest rates ever recorded…

25
25 African American and Hispanic Poverty fell in 1990s to lowest rates ever recorded…

26
26 Poverty Among young children rose rapidly from 1980 to 1983: why? Children are not responsible for their own poverty “There is no such thing as undeserving 5 year old.” Charles Murray Losing Ground (1984) But children do tend to live with working age adults who are expected to work and thus are not easy for government to help– unemploymen rose sharply 1980-83 Ellwood’s work-security and family structure helping conundrums… make public assistance more complex and private job and wage growth more important…
 But children do tend to live with working age adults who are expected to work and thus are not easy for government to help– unemploymen rose sharply Ellwood’s work-security and family structure helping conundrums… make public assistance more complex and private job and wage growth more important….")
27
27 Female Headed Households rose as a share of poor households in the 1960s

28
28 But share of persons living in FHH rose steadily, then leveled off after 1995

29
29

30
30 1996 welfare reform ends welfare as we knew it…

31
31 Single parent families for better or worse…

32
32 The Number of Poor Children increased dramatically in 1980s

33
33 Working Poor with no Medical Insurance: a full-time Job may not be Enough

34
34 Welfare Caseloads decline dramatically after 1996 due to welfare reform and a tight labor market…

35
35 Education is a Good Predictor of Poverty among Children Under 6...

36
36 Family Structure is also a factor...

37
37

38
38

39
39 But Race is not..

40
40 Families with Children do get In- Kind Transfers and Tax Credits To get an “alternative” poverty rate: take the official Census Bureau poverty line and add these in-in-kind, "near-cash" benefits: Food stamps, Housing subsidies & School lunches then add Earned Income Tax Credit (EITC) tax refunds and subtract federal, state, and payroll taxes. Source: http://cpmcnet.columbia.edu/dept/nccp/

41
41

42
42 In-kind Transfers and the EITC help, especially at the very bottom...

43
43 The EITC alone reduces under 6 poverty by 4% or about 10 million children

44
44

45
45

46
46

47
47 Teen birth rate rises then falls

Similar presentations